Coursework · MATLAB · Hydrodynamics
Predicting Full-Scale Yacht Resistance.
Using measurements from a 1:10 model to estimate the resistance of a seven-meter yacht.
The problem
Testing a full-size ship can be expensive, so engineers often work with smaller models. The challenge is that making a vessel smaller changes how it interacts with the water. This coursework analysis explored how measurements from a 1:10 model could be used to estimate the resistance of a seven-meter yacht.
The main issue was that wave-making and friction do not scale in the same way. Matching the Froude number lets us compare the model and yacht under similar conditions for wave formation. However, their Reynolds numbers are different, so simply multiplying the measured force by a scale factor would not account for the change in friction.
My approach
I used MATLAB to interpolate the supplied model resistance measurements over a range of speeds. For each full-scale speed, I calculated the corresponding model speed using Froude similarity.
I then estimated the model’s frictional resistance and subtracted it from its total resistance. I treated the remaining coefficient as an estimate of the wave-making contribution, carried it over to the full-scale yacht, and calculated friction separately using the yacht’s Reynolds number.
This produced three curves: estimated frictional resistance, estimated residuary resistance, and total resistance.
What the results showed
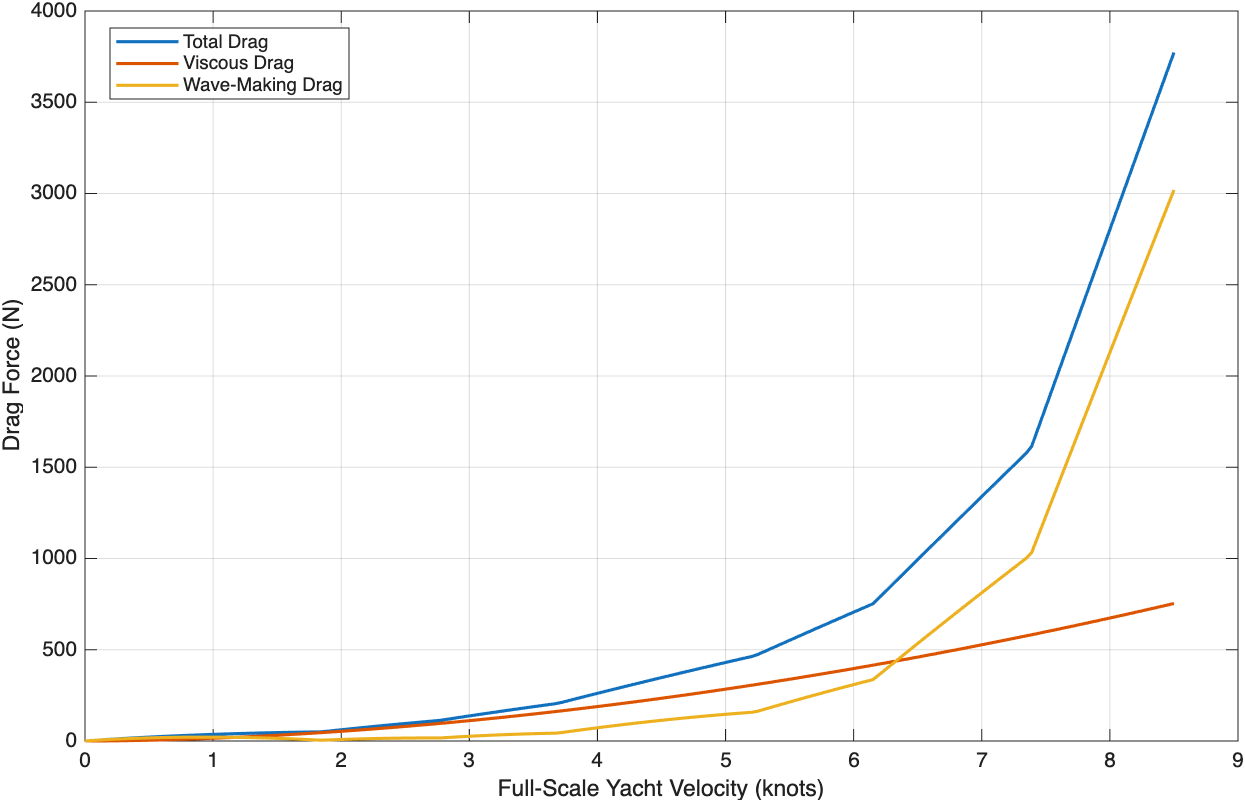
At lower speeds, friction accounted for most of the predicted resistance. Around 6.3 knots, the estimated residuary component overtook friction and began increasing much more sharply. By 8.5 knots, the predicted total resistance was approximately 3.8 kN.
What makes this interesting is that the yacht’s resistance does not increase evenly with speed. In the higher-speed range, a relatively small increase in speed comes with a much larger increase in the force needed to maintain it.
Limits of the analysis
These results are predictions based on model data, rather than measurements from the full-size yacht. The sharp corners in the curves come from linear interpolation and should not be interpreted as sudden physical changes.
The measured model speeds correspond to approximately 1.85–8.49 knots at full scale. I added a zero-force point at zero speed, but the region between that point and the first measurement is not supported by additional test data. The 8.5-knot endpoint also involves a small extrapolation beyond the highest measured speed.
The lower-speed region needs particular care. Connecting the origin to the first measurement with a straight line does not establish the correct physical behavior there. The friction correlation also assumes turbulent behavior, which limits its use at low Reynolds numbers.
Finally, subtracting friction does not isolate wave-making perfectly. The remainder is more accurately called residuary resistance because it can contain other effects.
What I take from this
The important part of this analysis is understanding what can be carried from a model to a full-size vessel and what needs to be recalculated. Matching one similarity condition does not mean that every part of the flow behaves the same way.